How an Infographic Comes Together
I’ve started to build up a portfolio of published infographics and I thought this would be a good point at which to document how I work.

A selection of published infographics from my portfolio.
Like any finished project, each graphic looks relatively simple, but the birthing process of any work of this kind is longer than you might think. In most projects that I’m offered, I’m given little more than a notion of what the final product should contain; I have a lot of freedom to determine what to include. As an illustrator, that kind of editorial freedom is great..but it does mean that I’ll be responsible for doing my own research on the subject to be illustrated. That means googling, reading up, then making my own determination about what facts need to be called out in order to give the reader a good handle on the subject. Infographics are by their nature brief, so the elements I choose to highlight must be important enough to include. Too much detail and the piece will be overwhelming. Too little detail and the piece fails as a tool for explanation.
Let’s take a look at a commission I received for an infographic explaining a NASA lunar probe called VIPER.
Research
The design brief from the client was as simple as could be:
Searching for water on the Moon. This would be another space-mission-focused infographic, based on NASA's 2023 VIPER rover, but we could put the emphasis on where & why there is water at the lunar south pole.
That’s it. Total freedom on the content and how to put it together. So, it’s off to Google and a bunch of NASA websites to start figuring out what this thing is, what it’s going to do, and why it’s important. I start by jotting down what I think might be important points and throwing in some sketches.

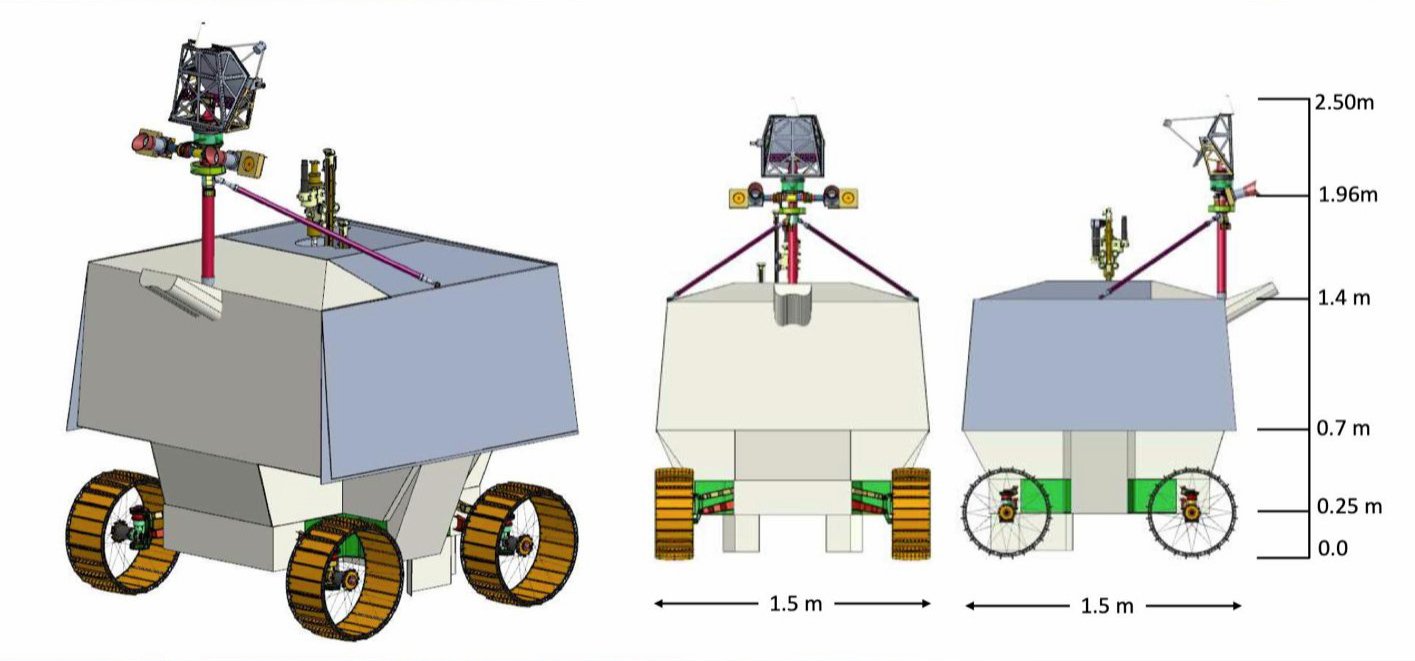
Obviously, I’m going to be drawing this rover. What does it look like? I found this reference (along with half a dozen other promotional renderings from NASA PR.
I know from my research that it’s going to be landing on the moon’s south pole near Nobile Crater. I wonder if there’s anything unique about how this particular crater looks, so I find an online lunar atlas that contains this image.

I didn’t find this to be particularly helpful and looked for a better visual reference for what the moon’s south pole looks like. There aren’t a lot of great photos of the southern pole, but I lucked out and managed to find this very helpful image.

I wanted to show where on the moon the rover would be conducting its mission. I couldn’t find a whole-moon view that included this southern pole view, so I had to mash up a couple of photos to create what I wanted. I also wanted to make it very clear that we’re looking at the pole. I decided the best way to indicate that would be with grid markings. I found a perfect reference for a polar grid and laid it over top of a photo of the moon and the south pole photo. The angle of the full moon image isn’t quite right, but it’s only for planning purposes, so it’s close enough.

My research into what VIPER was and what it was hopefully going to discover didn’t produce a lot of material. The mission was pretty straightforward: land on the moon, look for water. I was having a hard time finding interesting facts to hook into that would give me good visuals to build on. I did find mentions of VIPER extending knowledge gained from two spacecraft that had previosuly surveyed the moon from orbit: the Lunar Reconnaissance Observer (LRO) and the Lunar Crater Observation and Sensing Satellite (LCROSS). I created line drawings of both craft, intending to include them as small insets to provide background.

Conceptual Draft
I did a quick sketch of VIPER, added my moon composite, LRO, and LCROSS, and came up with an initial rough draft. This is what I pass back to the editor to get feedback to see if I’m on the right track before moving on to any detailed renderings. Guidance I get at this stage will save me a lot of time later if I find that the editor thinks I’m not hitting the mark. Everything is rendered in greyscale to keep evaluations focused on the ideas that the piece contains and prevent distractions that can be caused by the introduction of color.

Honestly, I wasn’t very happy with this concept…and neither was the editor. He supplied some very important suggestions that contained more detail than I would have thought appropriate. In particular, details of the various instruments that VIPER will carry. I thought that might be too much to include, whereas he thought it was important to show. I was only too happy to make the additions since it provided more to talk about. The other feedback I received was that he thought it was critical to show the planned route that VIPER would traverse. Also, he felt that looking backward at LRO and LCROSS wasn’t important at all. So, one visual element out, and a new one in.
Second Draft
Having received important feedback which helped to focus my thinking, the piece started to come together. I had more than enough detail to present and was challenged to find a way to squeeze it all in. I spent considerable time playing with the pieces moving them around like a puzzle to find a way to have them fit in a visually harmonious way, with a proper flow from low-detail to high-detail as the eye moves down the page. The result was this second draft that I returned to the editor for a final check-in on the concept.

This version was much more enthusiastically received which allowed me to start working on refining each of the visual elements for the final piece, including the moon, the navigation route, and the rover. I refined the rover by producing a carefully rendered wireframe and then adding shading onto which I would map foil textures in the final.

To complete the rover, I applied foil textures in Photoshop. I’ve done enough satellite and spacecraft illustrations to know that trying to render gold and silver foil by hand is a losing proposition; it just never seems to look right.

The last visual piece to be added was the rover’s planned navigation route. I found a map of the route that was overlaid on a photograph of the lunar surface, but in keeping with my hand-drawn style of illustration, I created my own version in Procreate. Here’s a time lapse video of that work.
Finished Product
While I will use photos that I find online for creating the conceptual draft, I like for the final product to contain as many hand-drawn elements as possible. It’s just my style preference. I created my own moon from scratch using the photo collage I made as a reference. Sometimes, however, looming deadlines mean that I can’t hand draw everything. In this case, I resorted to using a photo of the earth as well as photos of the lunar surface.
Here’s the finished piece as printed in American Scientist, Jan-Feb 2022, Volume 110 Number 1.
